The Boston Globe just can’t wrap its head around randomness in polling
In an article by Tal Kopan published today, The Boston Globe asks “Why are election polls all over the place, and which should you pay attention to?”
Here’s the lede:
WASHINGTON — Vice President Kamala Harris leads Donald Trump by 3 percentage points in Michigan. Or maybe it’s by 1 point. Or maybe Trump leads by 2. Or 4. It depends on the poll.
Which raises the question: Why is there so much variation?
This could have been a very short article. The answer is simple: sampling error.
What is sampling error and how does it apply here?
Sampling error is a simple concept. If there are, say 5.5 million voters likely to vote in the presidential election in Michigan and you only reach about 1,000 of them in a survey, you may just by random chance reach proportionally more Harris voters or Trump voters than are in the total population. That random variation in sampling introduces the possibility of error. Even assuming no other sources of distortion, polls will differ just due to random chance.
Here’s a little experiment for you. A poll of 1,000 voters shows Trump with a 1-point lead. Now let’s introduce a little random variation, and assume that 10 Trump voters in the poll are replaced by 10 Harris voters in the next poll. What does the new poll show now?
A 1-point Harris lead.
Here’s the (very simple) math. For now, assume there are no undecideds. The first poll reached 505 Trump voters and 495 Harris voters (50.5% to 49.5%, or a 1-point lead for Trump). In the second poll with the 10 Trump voters replaced by Harris voters, it’s 495 Trump vs. 505 Harris, 49.5% to 50.5%, or a 1-point Harris lead.
Even if we introduce, say, 2% undecided voters, the math would remain basically the same, and a 10-voter shift would have basically the same effect.
Just reach ten different voters in the poll and you get a 2-point swing in the result and a different answer for who wins the state.
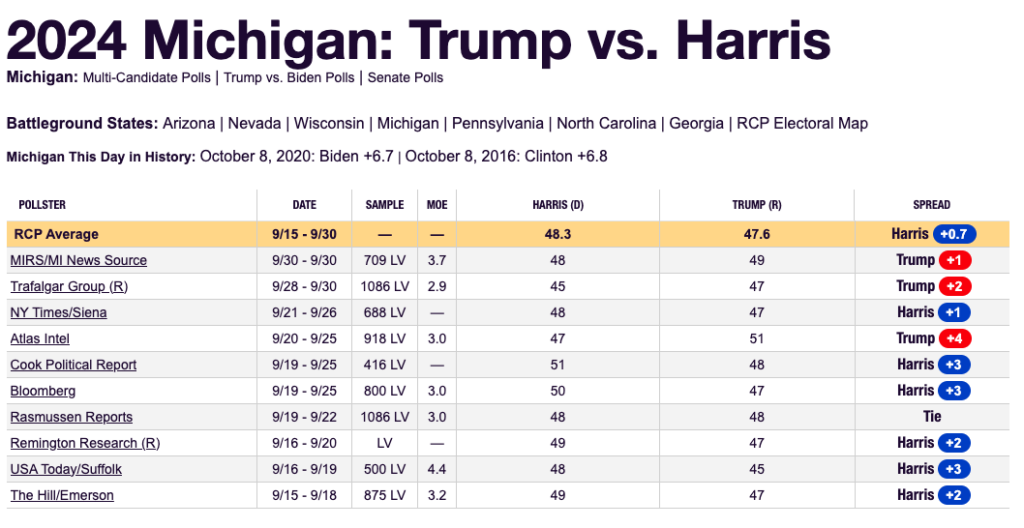
Here is the current RealClearPolitics polling summary for Michigan as of today, October 8, 2024:

Pay close attention to the “MOE” column, which is the margin of error. It shows the number by which the poll could be off due only to polling error. As you might expect, the margin of error is larger when the sample is smaller.
Because these polls reach between 400 and 1086 voters, the margin of error is around 3%. The error for the margin between Trump and Harris would be even higher, since every shift of 1% from Trump to Harris, or vice versa, causes a shift of 2% in the margin between the two.
The results for Harris are all within 3% of 48.3% for Harris. And with one exception, the numbers for Trump are all within 3% of 47.6% for Trump. The exception, the Atlas Intel poll, is quite close, only 3.4% different from that number.
Remember, the margin of error reflects the maximum amount of sampling error 95% of the time. Larger errors happen 5% of the time, or one poll out of 20. The Atlas Intel poll could very well reflect that higher possible error.
But the Globe article doesn’t mention randomness
Attempting to explain the variation in polls, the Globe mentions:
- Poor quality polls.
- People changing their minds.
- Likely voters vs. registered voters.
- Assuming the 2024 election patterns are similar to previous elections.
- Voters who weren’t likely to vote deciding to vote anyway.
- Weighting of polls to account for undersampling on race or other variables.
- Variations in polling methods (phone vs. online).
These explanations don’t even address the biggest problem: non-response bias. Polls can only reach people who take polls. That introduces a source of variation in an unknown direction that is impossible to correct for.
What’s really happening?
The Globe calls the results of these polls “seemingly contradictory results.”
What baloney.
While there are plenty of flaws in polling, the variation in these polls is easily explained by random sampling error.
Consider two possible explanations:
- The electorate’s opinion is shifting around by a few points from day to day and the polls are accurately reflecting those shifts.
- Pollsters reach only a small subset of voters, and small changes in those samples can make it appear as if opinions are shifting around when in fact, there is very little change happening.
Explanation 2 is far more likely. But to accept it, you need to get your head around the idea of random variation. And the Globe somehow can’t write about that, because math is too hard for readers, and because it’s more fun to talk about polling flaws.
This is a very close race. I don’t know who is going to win Michigan. I don’t know who is going to win the election. Neither do pollsters, and neither do you.
I guess we’ll just have to vote and see what happens.
I often read Simon Rosenberg who has a lot to say about the changed landscape of polls.
Josh, I like your simple presentation of randomness in polling. Perhaps they too are suggesting that readers don’t put too much stock in polls. You stimulated a good discussion and food for thought.
Do you think the math is beyond the capabilities of the Globe readers or the writers, etc.?
The writer either (1) didn’t understand uncertainty and error or (2) did understand, but didn’t think that the readers would be able to relate. Either way, I’m disappointed.