Is inflation surging or is it over? An explainer.
In the wake of last month’s inflation report, I’ve seen headlines that say that inflation is at record highs. Others say inflation is now zero.
The problem is that when it comes to rates, it’s easy to get confused — or to confuse people on purpose. So here’s an explainer.
Understanding rates
Let’s look at a quick analogy. Instead of prices, let’s look at a car stopped at a stop light. As soon as it starts, you want to measure its movement.
Start with its distance from the starting line. You measure that in meters, feet, kilometers, or miles.
As soon as it starts to move, it has a rate of motion, or speed. At any given moment the speedometer might measure 15 miles per hour, or 25 miles per hour. That’s the instantaneous speed. You can also measure speed over a time period. If the car travels 30 miles in the first hour, then its speed over that interval is 30 miles per hour. During that hour, it might have been traveling 50 miles per hour at one moment and stopped — 0 miles per hour — at another moment, but the average speed measures movement over the whole hour.
Because speed also changes, we can measure the rate of change of speed. That is acceleration. A car that goes from 10 miles per hour to 50 miles per hour in 10 seconds is accelerating — and you can feel it. And a car going from 50 miles per hour to 10 miles per hour has a negative acceleration, and you can feel that, too. Notice that even the car that is negatively accelerating is still moving forward at a positive speed, and still gaining distance, just more slowly.
(If this is giving you a flashback to calculus, good for you, but there will be no complicated math or equations here, so please sit back in your bucket seat and relax.)
What does inflation measure?
Inflation is a rate of change, just as speed is. If a gallon of milk cost $5.00 in June and the same gallon cost $5.05 in July, it experienced an inflation of 1%, because the $0.05 increase is 1% of $5.00.
To make it easier to compare inflation rates, they’re typically given as “annual” rates. This calculation is easy. You just multiply the monthly change by 12. If the gallon of milk increased 1% in price in a month — and if the rate of inflation stayed the same — it would increase 12% in a year. (There are slight differences because of compounding — increases on top of increases — but we can ignore those for now.)
This is like a car that travels 1 mile in 1 minute. It’s traveling a mile per minute. If it traveled at that rate for a full hour, it would travel 60 miles in 60 minutes, or 60 miles per hour.
The government’s measure of inflation, the consumer price index measures inflation rates by looking at a basket of purchases of lots of items — rent, food, gas, services, cars, and so on, averaged over many data points collected throughout the country. It is based on purchases by urban consumers. If gas goes up and milk goes down, both of those purchases affect the CPI. The government also reports inflation for subsets of the basket of purchases, such as food prices or gas prices. There is also a “core” inflation indicator that eliminates the volatile price categories of food and gas. This is important because while we as consumers still have to pay those higher prices, the Federal Reserve Bank doesn’t want to set policy based on a transitory spike in prices caused by, for example, the war in Ukraine.
So what happened in July?
Average consumer prices in July 2022 were unchanged from June. One reason was that while some prices rose, gas prices fell significantly from their peak in the month before. So the average increase was zero. Here’s a chart from the Washington Post showing how that looks in context of the previous months.
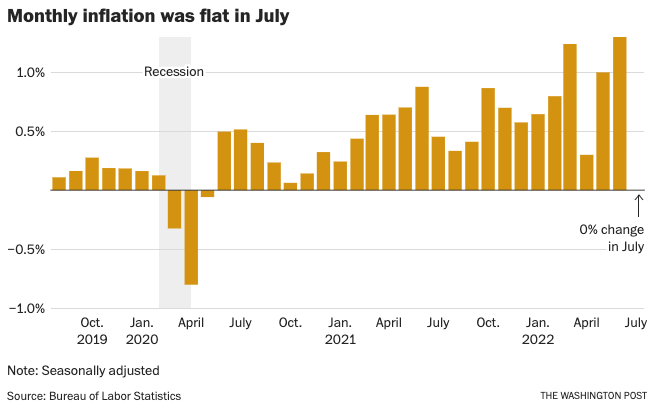
As you can see, inflation bounces around a lot. The June number was about 1.2%, for an annualized rate of about 14%. Which is pretty scary. So while the zero inflation in July is good news, it just means average prices didn’t rise in one month.
One way to smooth out all this bouncing around is to look at total inflation over the past 12 months. In any given month, you can go back and see how much prices have changed over the previous year: year-over-year inflation. On that basis, the trailing 12-month number for July was 8.5%.
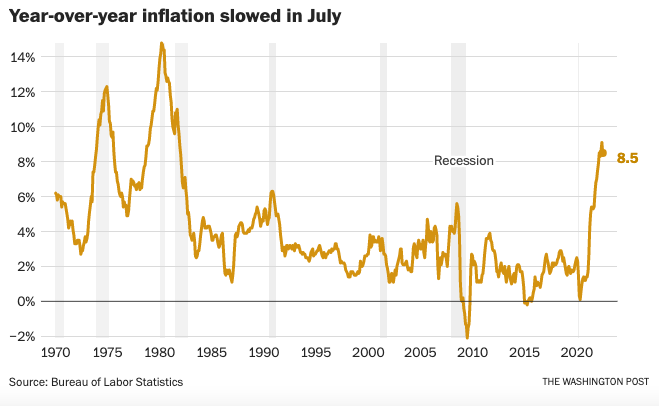
Washington Post chart of year-over-year inflation
That 8.5% is still pretty high, unless you got a 10% raise over the year.
You will also see headlines that inflation is down. What does that mean?
Well, the year-over-year number in June was 9.1%. This month it’s 8.5%. So something decreased. What was it?
Did prices decrease over the course of the year? Definitely not. They increased 8.5%.
But the rate of price increases — the inflation rate — went down from 9.1% to 8.5%. Using our car analogy, inflation is decelerating, but still moving forward. The rate of increase of prices is slowing. But they’re still increasing.
If the government’s actions (or anything else) continue to slow inflation, then the monthly numbers will continue be low, and the year-over-year numbers will come down. But they will come down steadily, not precipitously, because the previous 11 months of inflation is still baked into that year-over-year number.
What about core inflation?
Obviously, the volatile price of gasoline had an outsized influence on the inflation rate. What happens if we remove food and gas prices from the calculation? How is the rest of the economy doing?
Core inflation — excluding gas and food — was 0.3% for the month of July, or 3.6% annualized. And looking at the trailing 12 months, or year-over-year, it was 5.9%.
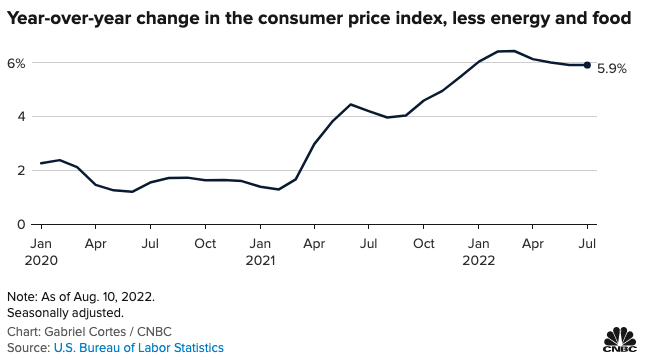
That 0.3% increase was down from 0.5% last month, and the 5.9% year-over-year was down from 6.1% last month. So again, the inflation car is slowing down, but core inflation remains at historically high rates.
If inflation stays high, the Federal Reserve Bank hikes interest rates, which increases the cost of borrowing, which slows consumer and business demand. That tends to moderate inflation (less demand for equal supply means lower prices), which is why the Fed takes that action.
But lower demand also means lower sales, which makes business results worse.
With the inflation rate ticking down, the Fed is less likely to keep ratcheting up interest rates at the extreme pace it has been following so far. Lower rates are better for business, which is why the stock market rallied on the inflation news.
So which is it: surging inflation or zero inflation?
What’s the honest headline here?
The zero inflation headline is an anomaly based on the drop in gas prices following previous highs. That’s nice, but it’s hardly the whole story.
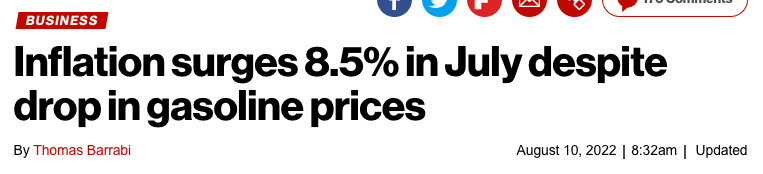
And while inflation rates are still quite high, they are moving downward. So “surging” isn’t really fair, either. That’s just the New York Post being inflammatory. (The car is slowing down, not speeding up.)
An accurate headline would be something like this:
High gas prices are now plummeting while core inflation, while still at a historically high level, is moderating slightly.
Bottom line: this car is slowing down, but it’s still going too fast. That’s scary for people who spend money. It would be good if the Fed’s efforts continued to bring inflation down to a more moderate level, and if wages could catch up, and if we could avoid reducing demand so severely that we enter a recession.
I hope this helps make things clearer when you look at the next month’s numbers. And watch out for biased headlines.
Your advice supports the findings of Nieman Journalism Lab: “‘Number soup’: Can we make it easier for readers to digest all the numbers journalists stuff into their stories?”
https://www.niemanlab.org/2022/08/number-soup-can-we-make-it-easier-for-readers-to-digest-all-the-numbers-journalists-stuff-into-their-stories/